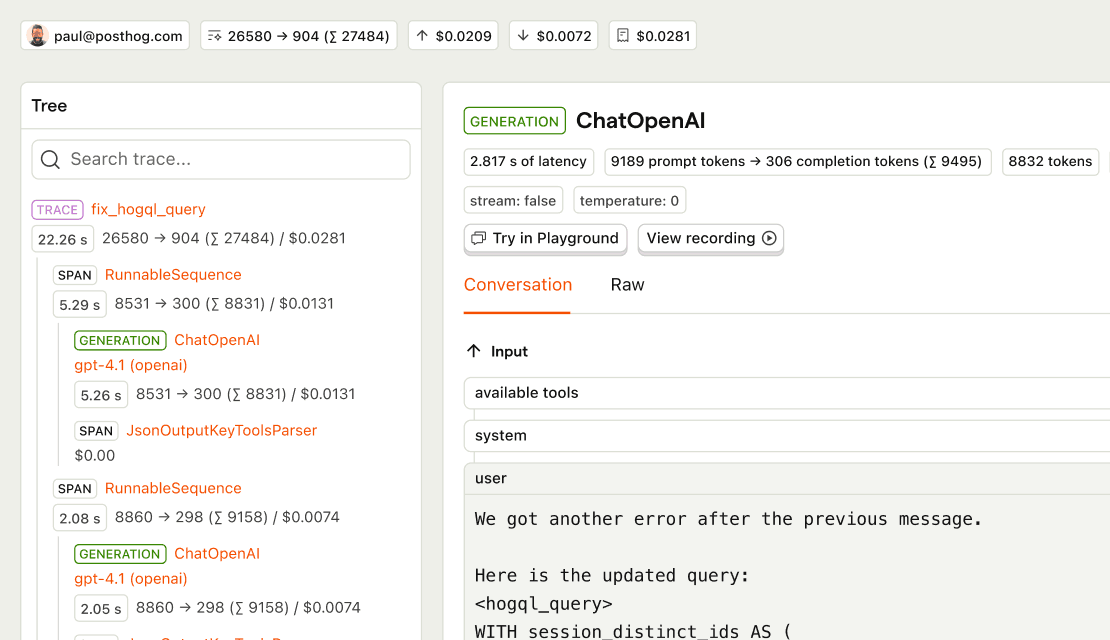
AI Observability screenshot
A hedgehog with a robot
AI Observability

Observe and debug AI in production

Product analytics for LLMs. Inspect traces, spans, latency, usage, and per-user costs for AI-powered features – the context agents use to fix LLM behavior.

Get started - free

Install with AI in a single prompt

Paste into your terminal or code editor and make AI do the work.

Learn more

MCPWatch a demoTalk to a human

What does it do?

A hedgehog inspecting a trace with a magnifying glass

AI Observability records every call your product makes to an LLM – the prompt that went in, the response that came out, which model answered, how long it took, what it cost, and who it was for. Calls that belong to the same conversation or agent run are stitched together into a trace, so a multi-step interaction reads as one story instead of a pile of unrelated requests. It's all captured as regular PostHog events, which is why your LLM data sits next to your product analytics, replays, and errors instead of in a separate tool.

Who is it for?

AI Observability is used across teams depending on your role.

Role
Use cases
AI Engineers
Debug traces span by span and compare models on cost, latency, and quality
Product Engineers
Tie failed generations and latency spikes back to the users who hit them
PMs
See which AI features people actually use, and whether using them changes retention
Finance & leadership
Attribute token spend to models, features, and individual customers
Support Engineers
Read the exact conversation behind a ticket, then watch the session it happened in

How do I use it?

There are a few ways to explore AI Observability.

Query LLM traces from your editor

Check LLM costs, monitor errors, and analyze model performance from Cursor, Claude Code, VS Code, or any MCP-compatible agent.

Check costs before and after deploys
Compare LLM spend across periods to spot unexpected jumps before they compound.
Monitor errors
Surface failing LLM calls so your agent can flag or fix them immediately.
Compare models
Evaluate cost, latency, and token usage across models to pick the right one per feature.
Find expensive traces
Drill into individual calls to identify optimization opportunities.

Install the PostHog MCP

Learn more
npx @posthog/wizard mcp add

Supports Next.js, React, Python, and

Top features

Traces

Debug entire conversations, not just individual calls. PostHog automatically captures properties like person, total cost, total latency, and more.

See an interaction timeline including all generation and span events.
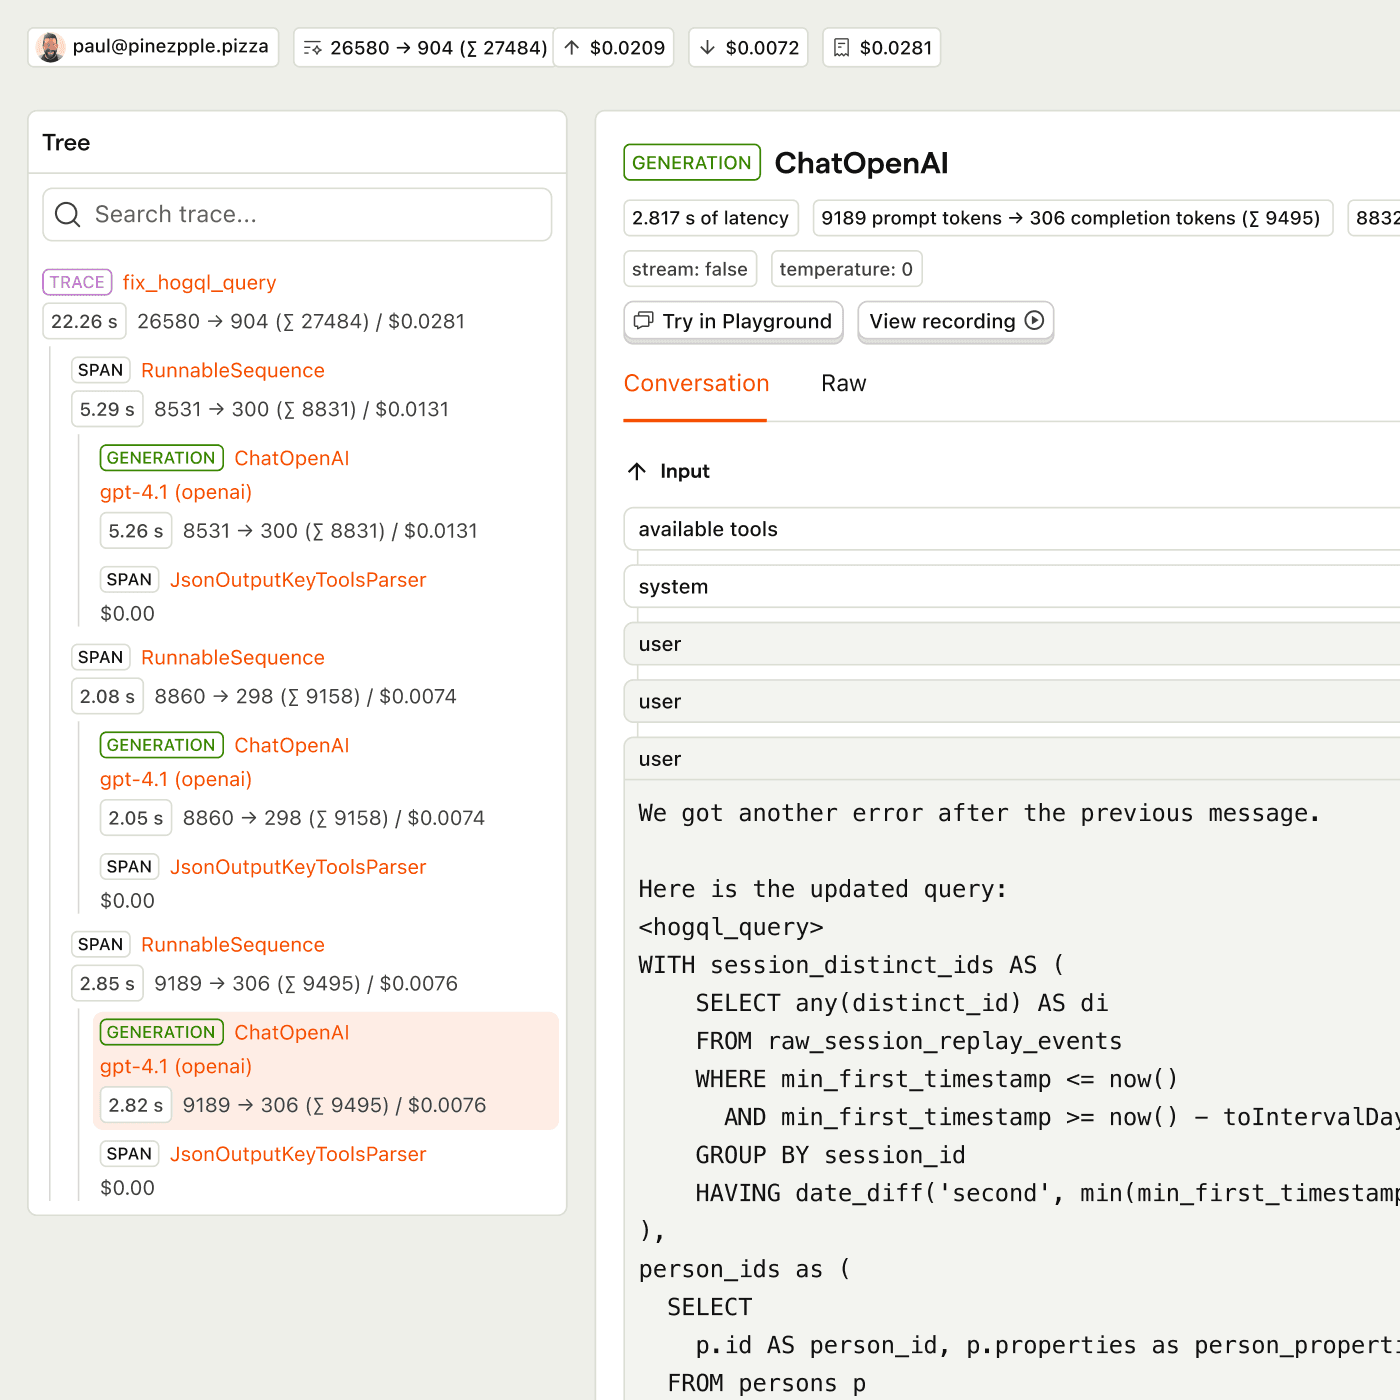
Multi-turn conversation history
Track prompts, completions, and token counts for every interaction
User attribution
Trace AI interactions to specific users and organizations
Integrated session recordings
Observe any changes to your UI based on the LLM's response
Metadata tracking
Add custom properties like conversation ID, session, or feature
Privacy mode
Optionally exclude sensitive data from being captured
LLM trace

AI prompts

Ask PostHog AI to check what your LLM calls cost, dig into traces, and compare models. Works in PostHog AI (in-app chat), PostHog Desktop (our AI code editor), and in your product editor (using the MCP). Already signed in? Click a prompt to try it.

Works with other PostHog tools

Use AI Observability with these other PostHog apps to maximize shareholder value.

Works with...

Questions?

Answers

There are a few ways you can get answers to specific questions about AI Observability.

  1. Check the docs

    We have an entire docs-wizard dedicated to docs gardening.

  2. Search the community forums

    81 discussions about AI Observability, there's a good chance your answer is already answered!

  3. Ask PostHog AI

    It's an incredibly useful AI chat that understands the product, docs, community questions, our codebase, GitHub issues, and industry knowledge.

  4. Talk to a human

    Dedicated humans are standing by and ready to assist. Best for questions about volume pricing, terms, and sexy legal stuff.

Recent discussions

Feature comparison

Langfuse
LangSmith
Helicone
Braintrust
Generation tracking
Latency tracking
Track response times and identify slow prompts, models, and workflow steps
Cost tracking
Includes cost per user and broken down by provider, models
Trace visualization
View complete request traces across prompts, model calls, tools, and workflows
Token tracking
Prompt playground
Interactive testing environment for prompts and models
Prompt evaluations
Online LLM-as-a-Judge evaluations for measuring AI output quality
Alerting
Error tracking
Grouped error tracking for LLM applications
System prompts
Create and manage system prompts from the PostHog UI
Clustering
Automatic grouping of similar traces and outputs
Trace summarization
AI-generated summaries for quick understanding
LLM translation
Translation of non-English LLM traces to English
Sentiment classification
Automatically classify user messages as positive, neutral, or negative
Beta
Privacy mode
Mask prompts and responses before they are stored
Agent/multi-step tracing
Understand complex agent and tool-calling workflows
Basic
Basic
Prompt management
Create, version, and manage prompts
Beta
Evaluation datasets
Create datasets for experimentation and benchmarking outputs
Human annotation/review
Review and label model outputs manually
Session replay
Watch recordings of users interacting with AI features
Product analytics
Analyze AI interactions alongside retention, funnels, and feature adoption
AI gateway/proxy
Route LLM requests through a gateway for caching, rate limits, fallbacks, and observability
Tracing
Trace requests across prompts, model calls, tools, and workflows
Hierarchical traces
Nested spans showing the full call flow
Custom spans
Instrument any operation as a span
Tool call tracking
Track function/tool calls in AI agents
RAG retrieval tracking
Monitor retrieval steps in RAG pipelines
Session grouping
Group traces into user sessions
OpenTelemetry support
Ingest traces via the OTel protocol
Async ingestion
Non-blocking trace collection
Multi-model support
Track calls across LLM providers
Session replay link
Jump from a trace to the user's session recording
User profile context
Connect traces to full user profiles with behavioral history
Partial
SQL queries on traces
Query trace data alongside product events
Trace explorer UI
Dedicated interface for browsing and filtering traces
Basic
Advanced
Prompt management
Create, version, deploy, and test prompts
Prompt versioning
Track changes to prompts over time
Beta
Template variables
Dynamic {{variables}} compiled at runtime
Beta
Prompt deployment API
Fetch the active prompt version via SDK
Beta
Version comparison
Side-by-side diff of prompt versions
Beta
Prompt labels
Tag prompts as production, staging, latest
Prompt playground
Test and compare prompts interactively
Composable prompts
Link and chain prompts together
MCP server for prompts
Manage prompts via AI coding agents
Beta
A/B test prompt versions
Split users between versions, measure cost, latency, and eval pass rate
Beta
Evaluations
Score, review, and test LLM outputs
LLM-as-a-judge
Use models to score outputs automatically
Code evaluators
Custom scoring functions for automated eval
Annotation queues
Assign human reviewers to score outputs
Datasets
Curate sets of inputs and expected outputs
Experiment runs
Run evaluation pipelines across datasets
A/B experiments on product metrics
Statistical tests measuring impact on real user behavior
Costs
Track token usage, model costs, and spending trends
Token counting
Track input and output tokens per call
Cost calculation
Dollar cost per generation
Cost by model
Break down spending by model
Cost trends
Historical cost over time
Cost by user
See what individual users cost you
Partial
Cost by feature
Break down spending by product feature
Cost by cohort
Compare costs across user segments

Get started – free

No credit card required. You get the first 100,000 events free every month, then pricing starts at $0.00006/event and reduces with volume.

Install with AI

Run this command in your terminal or AI editor.
npx -y @posthog/wizard@latest

Supports Next.js, React, Python, and

Install without AI

Sign up for a free account and follow the install instructions for your stack.

Get started - free